Tutorial: equal weighted equity strategy#
This tutorial shows new users to the SigTech platform how to construct a systematic investment strategy where the strategy involves an equal weighted equities portfolio, based on a market capitalisation filtering of the S&P 500 universe.
Learn more: Example notebooks
Caution: this notebook will perform heavy computations that will require an instance running with a minimum configuration of 4 vCPU and 16 GiB. The configuration is performed once you are logged into the SigTech platform. To change configuration of running instances, stop the current research environment and change the configuration.
Workflow overview#
When creating an investment strategy on the SigTech platform, the workflow tends to follow these steps:
Set up the environment
Define the investment universe
Create the strategy
Construct the portfolio
Generate the performance report
Environment#
Import Python libraries and initialize the SigTech environment:
from uuid import uuid4
import datetime as dtm
import numpy as np
import pandas as pd

import sigtech.framework as sig

env = sig.init()
Learn more: Setting up the environment
Define the investment universe#
Define a range of global parameters used for creating the investment strategy. There are a number of equity indices available on the SigTech platform; in this example the SPX INDEX is used. Use the Market Data section of the SigTech platform to find other available indices.
START_DATE = dtm.datetime(2021, 1, 4)
END_DATE = dtm.datetime(2021, 5, 31)
CURRENCY = 'USD'
EQ_INDEX = 'SPX INDEX'
The equity index is filtered by using the EquityUniverseFilter class.
Learn more: to learn more about different methods to perform universe filtering, see Single Stocks.
In this case the filter retains the top 5% of the universe, in terms of market capitalisation. The filtered universe is stored in the variable universe as a Python dictionary.
dates = pd.date_range(START_DATE, END_DATE, freq="d")
equity_filter = sig.EquityUniverseFilter(EQ_INDEX)
equity_filter.add('Market Cap', 'top', 5, 'quarterly', percent=True)
universe = equity_filter.apply_filter(dates).to_dict()
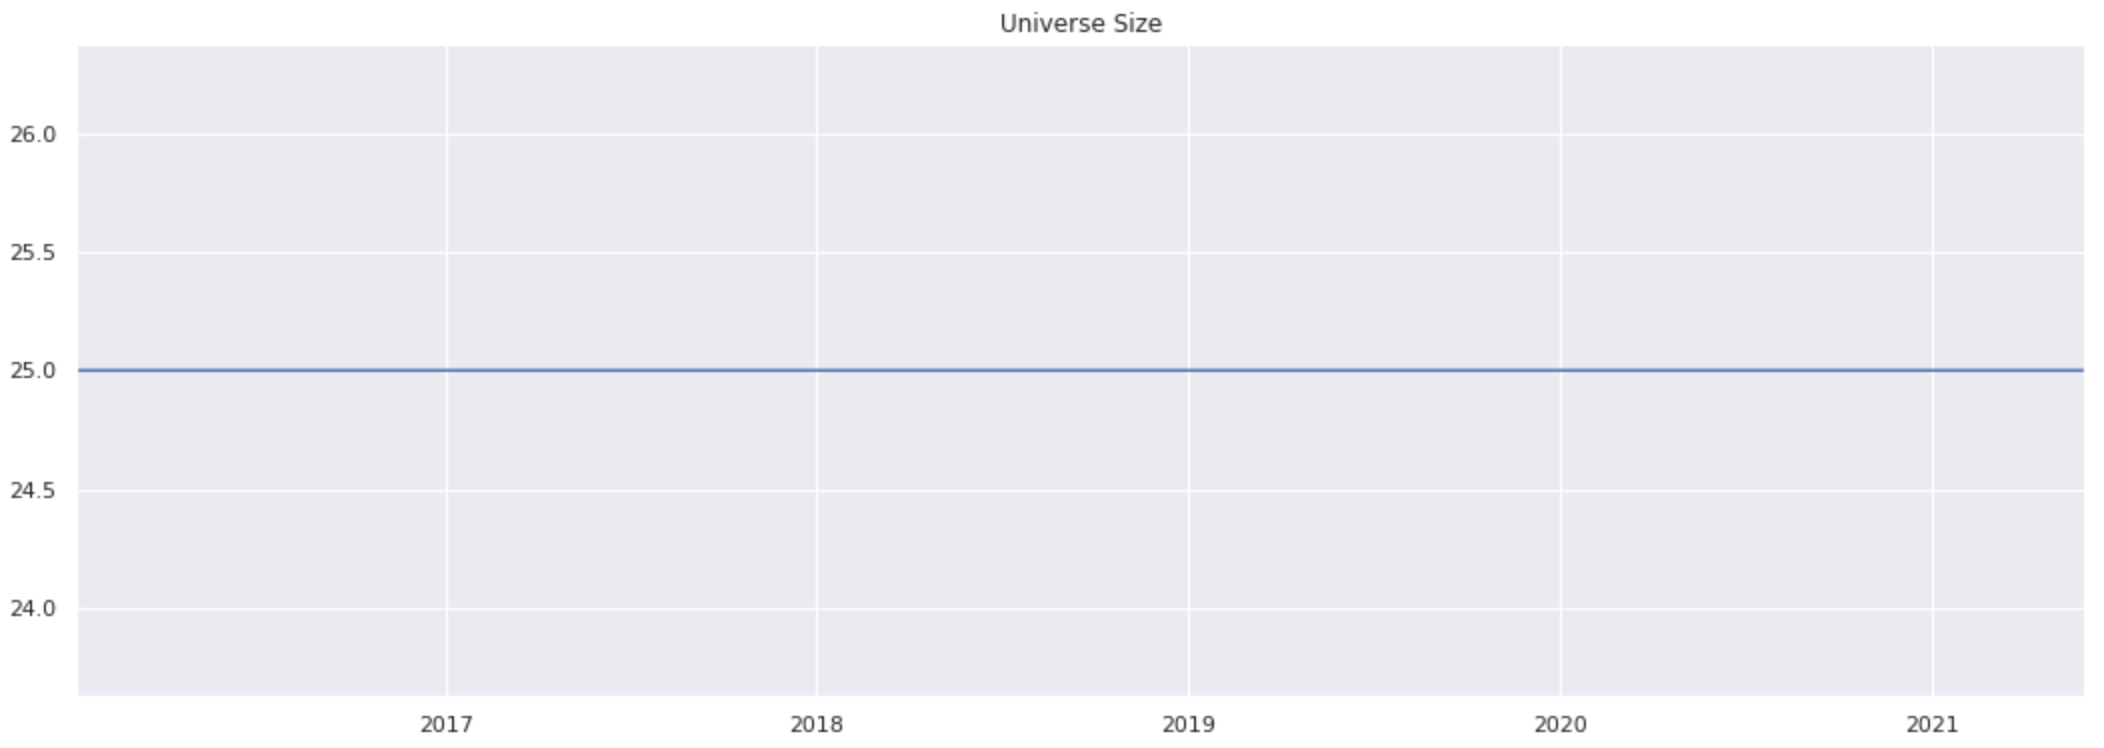
The following code block is run to visually show the effect of the universe filtering; the amount of securities, on the y-axis, that the universe contains through time.
pd.Series({d: len(v) for d, v in universe.items()}).plot(title='Universe Size')
The following code block will do the following:
Unpack the values in the Python dictionary.
Perform a union of the values.
Remove all the duplicate values, by turning it into a set.
all_stocks is a set consisting of all securities that are in the filtered investment universe on at least one date.
all_stocks = list(set().union(*universe.values()))
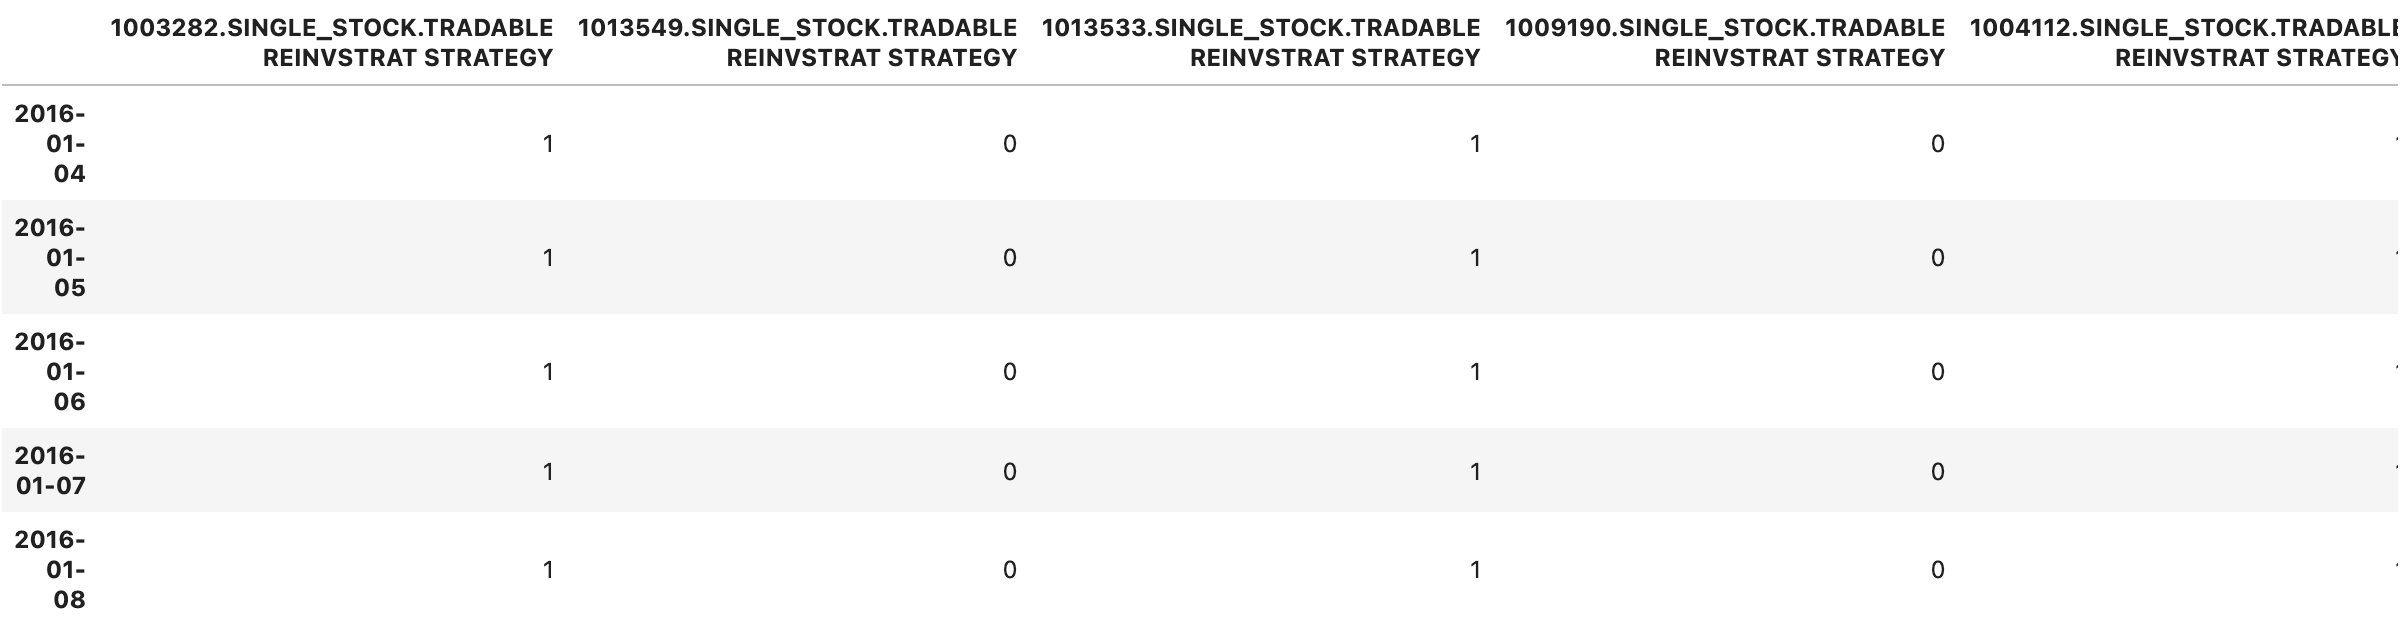
The pandas DataFrame ison indicates which securities are contained within our investment universe through time. The value 1 indicates membership on a given date, whereas the value 0 indicates absence from the investment universe.
ison = pd.DataFrame(0, index=universe.keys(), columns=all_stocks)
for d, v in universe.items():
    ison.loc[d, v] = 1
ison.columns = [f'{c} REINVSTRAT STRATEGY' for c in ison.columns]
A sub-section of the pandas DataFrame isonis shown below:
ison.iloc[:5, :5]
When single stocks are included in the investment strategy, there’s a need to handle all the corporate actions that may arise. To solve this, the building block ReinvestmentStrategy is used. This generic strategy takes 100% exposure to an underlying single stock, handles corporate actions as they arise, and adjusts the stock and cash positions accordingly.
Learn more: Reinvestment Strategy
To further speed up runtime when creating the ReinvestmentStrategy objects, the computations run in parallel.
@sig.remote
def get_rs(ticker):
    t = f'{ticker} REINVSTRAT'
    try:
        rs = sig.obj.get(f'{t} STRATEGY').name
    except:
        print(f'# Getting reinvestment strategy for {ticker}')
        stock = sig.obj.get(ticker)
        rs = sig.ReinvestmentStrategy(
            currency=stock.currency,
            underlyer=ticker,
            start_date=max(START_DATE, stock.history().first_valid_index()),
            end_date=END_DATE,
            ticker=f'{t}',

            # Trigger order to trade out before expiry, e.g. delisting
            final_trade_out=True,
            # Place adjustments to minimize exposure slippage
            enable_tracking=True,
            # No withholding tax
            withholding_tax_override=0.0,
        )
        _ = rs.history()
    return rs.name
get_rs
Performance time series of strategies that are being computed on the SigTech platform get cached. Using a try and except block, such as in the above code block, could have a significant impact on runtime, since already calculated strategies can be loaded via the sig.obj.get syntax.
Using the list comprehension below, a ReinvestmentStrategy object is created for all stocks and the sig.calc method allows for running the function in parallel:
reinvestment_strategies = sig.calc_remote([get_rs(x) for x in all_stocks])
Create the strategy#
The Equity Investment Strategy will allocate an equal weight of the portfolio to each of the stocks (more specifically to those stocks’ ReinvestmentStrategy objects) that have been chosen based on the universe filter. The portfolio will be rebalanced at the end of every month.
The ison pandas DataFrame is transformed to form an equal weight signal:
signal = ison.divide(ison.sum(axis=1), axis=0)
The pandas DataFrame gets turned into a Strategy object with the SignalStrategy building block. There are numerous different parameters the user can utilise. For example, different allocation functions that map the signal to asset allocations in the strategy.
Learn more: Signal Strategy
ew_strategy = sig.SignalStrategy(
    # Base currency of the strategy
    currency=CURRENCY,

    # Start date of the strategy
    start_date=signal.first_valid_index(),

    # End date of the strategy
    end_date=END_DATE,

    # The Signal DataFrame turned into a signal object
    # with the help of the signal_library
    signal_name=sig.signal_library.from_ts(signal).name,

    # Rebalance frequency of the portfolio
    rebalance_frequency='EOM',

    # On the instruments which have a negative weight,
    # refrain from creating a short version of that
    # instrument
    convert_long_short_weight=False,

    # Name of the strategy
    ticker=f'EW {str(uuid4())[:5]}'
)
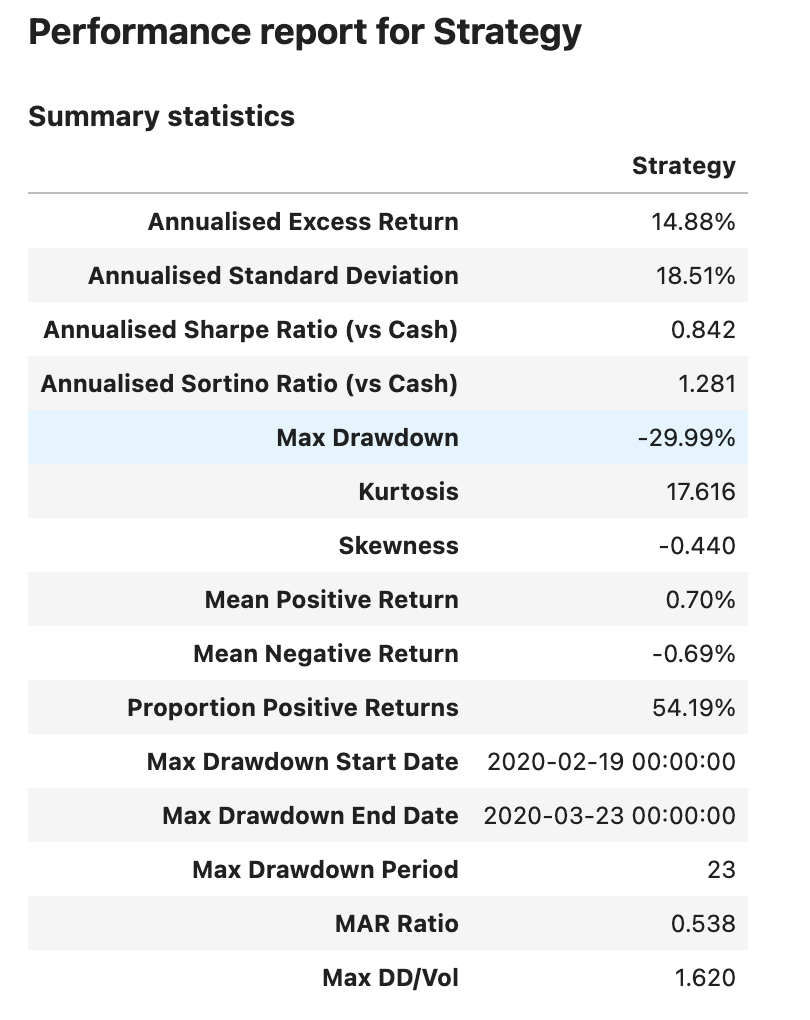
Generate the performance report#
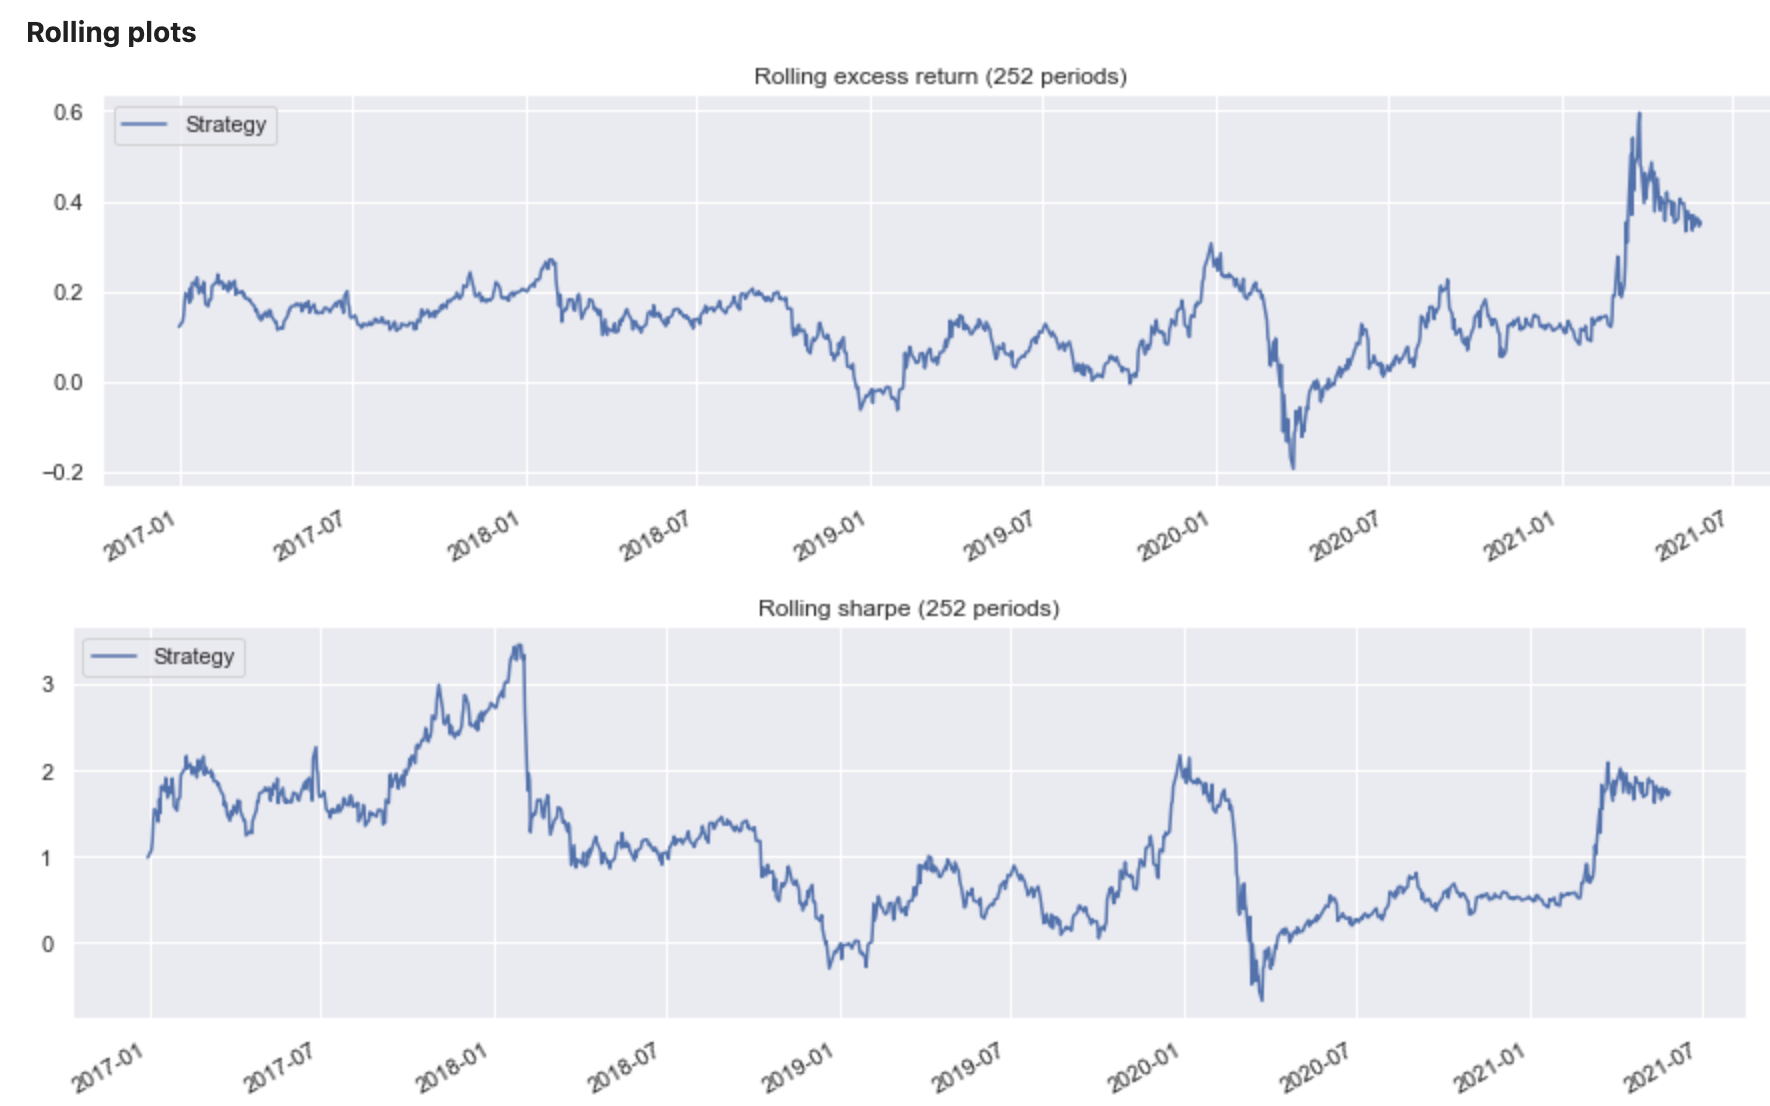
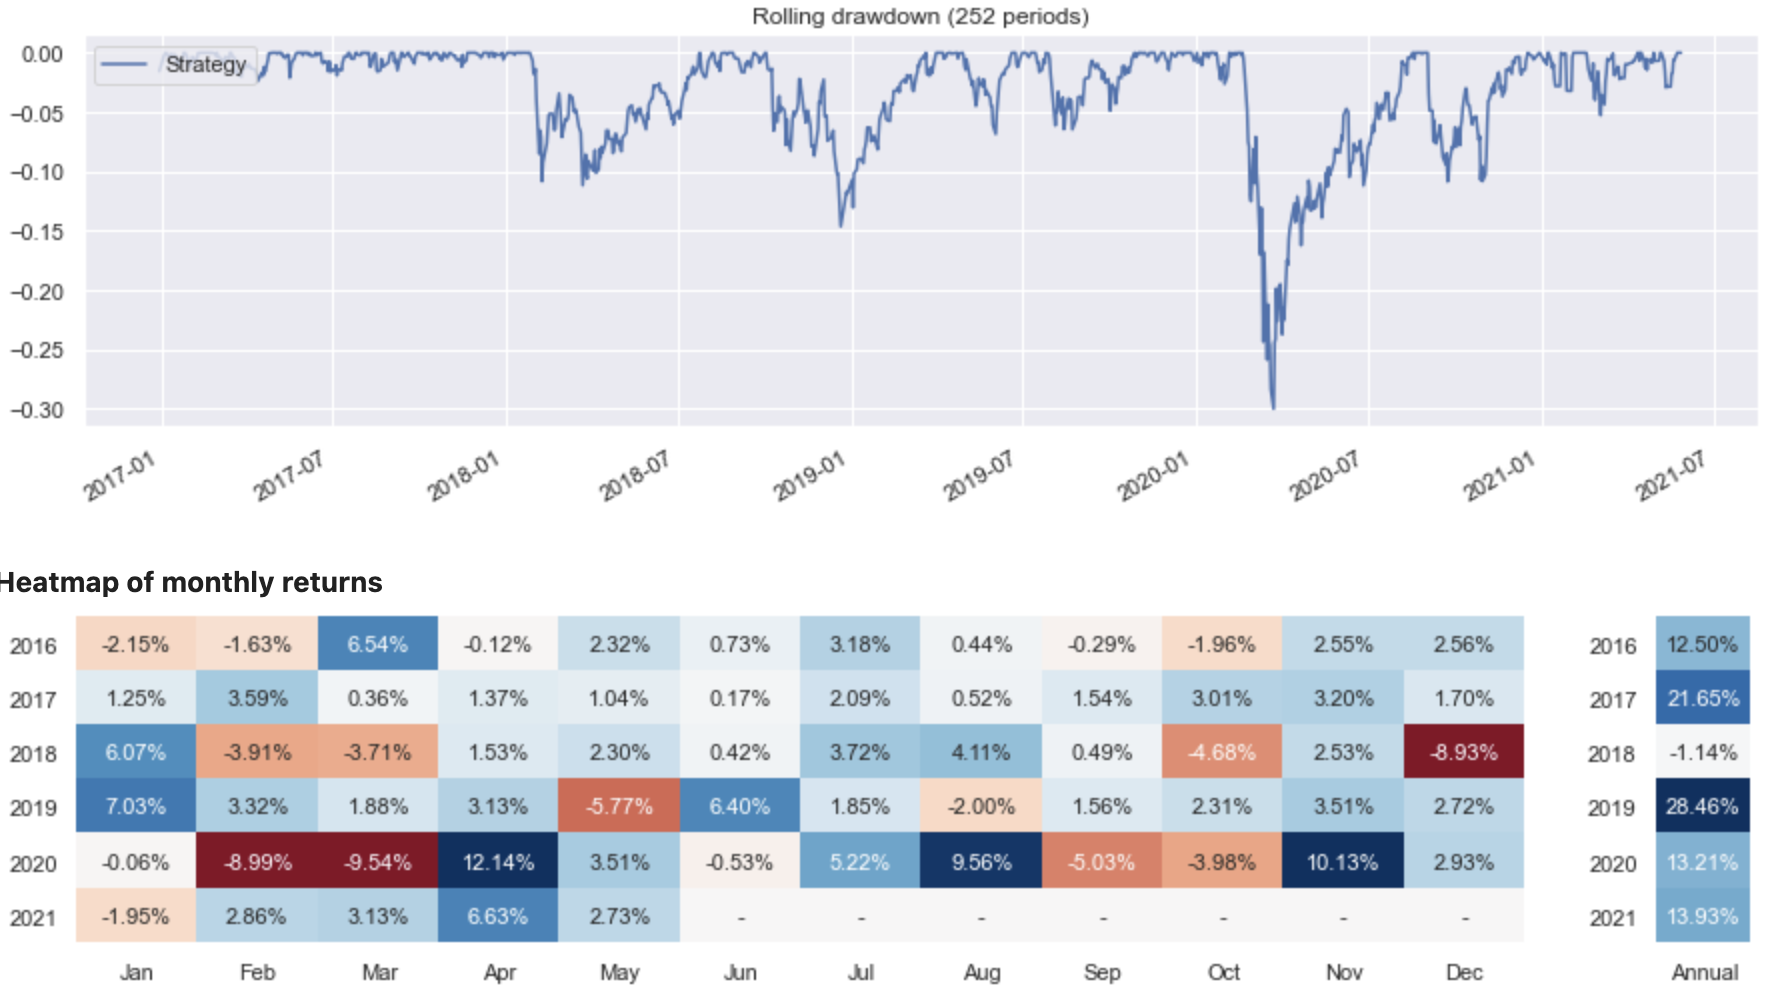
Once the strategy is created, the following code block is used to create a performance report containing information on:
Metrics
Rolling performance charts
Performance heat maps
There are a wide range of different performance views and reports available for the user which might be relevant depending on the specific use case.
Learn more: Performance Analytics
sig.PerformanceReport(ew_strategy).report()