Technical Indicators#
Importing relevant libraries and initialising the environment.
import sigtech.framework as sig
import sigtech.framework.signal.library.technical_indicators as tech_ind

sig.init()
Getting the settlement history for a security
future = sig.obj.get("BTCZ21 CURNCY")

# Get settlement history
future.history()
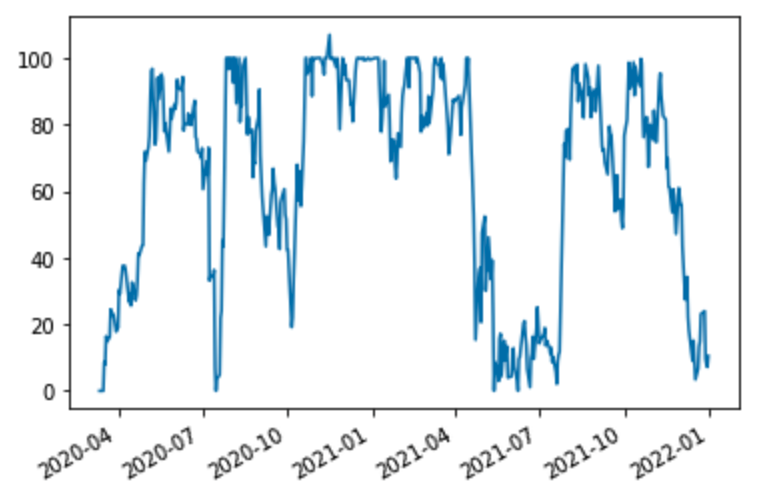
Average Direction Index (ADX)#
This indicator measures the strength of a trend, not the direction.
Note: close, high and low arguments can be replaced by passing df=prices_df where prices_df contains (case-insensitive) columns of ‘Open’, ‘High’ and ‘Low’.
Python:
adx = tech_ind.adx(
    high = future.history(field="HighPrice"),
    low = future.history(field="LowPrice"),
    close = future.history(field="LastPrice"),
    window = 50,
    ewma = True
)

adx.plot()
Output:
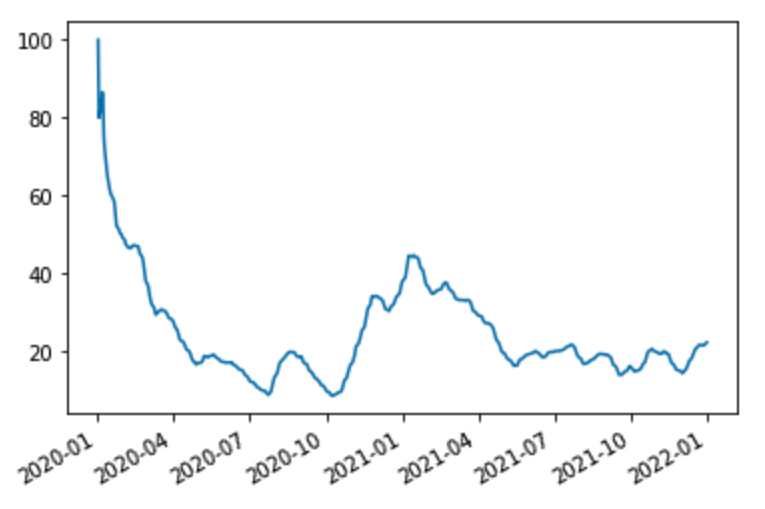
Average True Range#
Average True Range is used to find the average true range for the supplied prices (degree of price volatility). ATR is the EWMA of the true range = max(high_t, close_{t-1}) - min(low_t, close_{t-1}).
Note: close, high and low arguments can be replaced by passing df=prices_df where prices_df contains (case-insensitive) columns of ‘Open’, ‘High’ and ‘Low’.
Python:
atr = tech_ind.average_true_range(
    high = future.history(field="HighPrice"),
    low = future.history(field="LowPrice"),
    close = future.history(field="LastPrice"),
    window = 50
)

atr.plot()
Output:

Bollinger Bands#
They represent the percentage position of the close price inside the Bollinger band.
Python:
boll = tech_ind.boll(
    high = future.history(field="HighPrice"),
    low = future.history(field="LowPrice"),
    close = future.history(field="LastPrice"),
    window = 50
)

boll.plot()
Output:
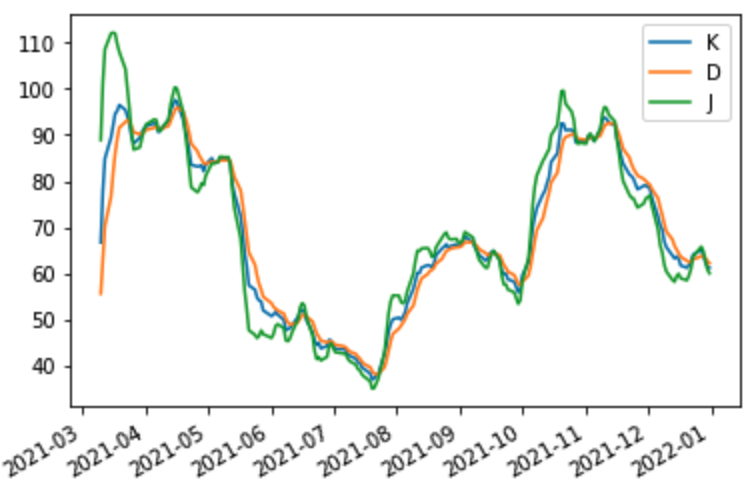
KDJ Indicator#
The stochastic indicator KDJ is a statistical system used for the analysis of securities. It accepts the closing price, highest price and lowest price of the calculation interval selected. It calculates the immature random value RSV of the last calculation cycle using the relationship between the inputs, and then calculate the K value, D value and J value according to the smooth moving average method.
Python:
kdj = tech_ind.kdj(
    high = future.history(field="HighPrice"),
    low = future.history(field="LowPrice"),
    close = future.history(field="LastPrice"),
    window = 300,
    k_smooth = 1,
    d_smooth = 1,
    j_smooth = 1
)

kdj.plot()
Output:
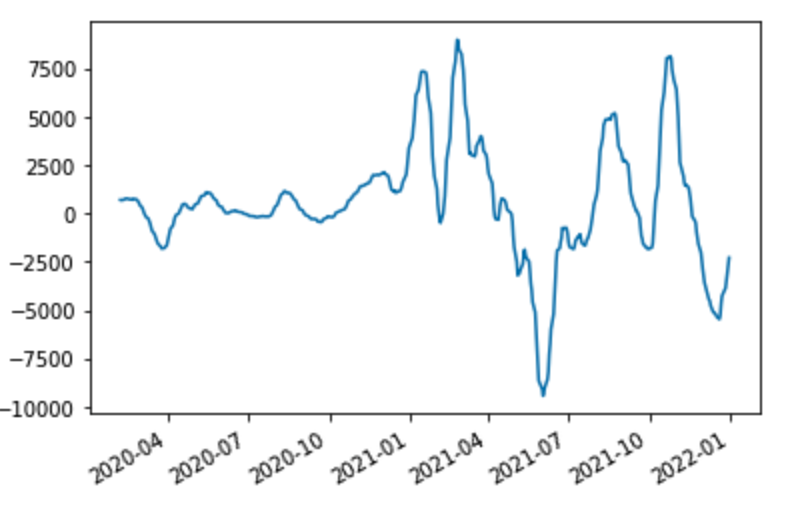
MACD#
Moving average convergence divergence (MACD) is a trend-following momentum indicator that shows the relationship between two moving averages of a security’s price. The MACD is calculated by subtracting the 26-period exponential moving average (EMA) from the 12-period EMA.
Python:
macd = tech_ind.macd(
    close = future.history(field="LastPrice"),
    short_window = 12,
    long_window = 26
)

macd["MACD"].plot()
Output:
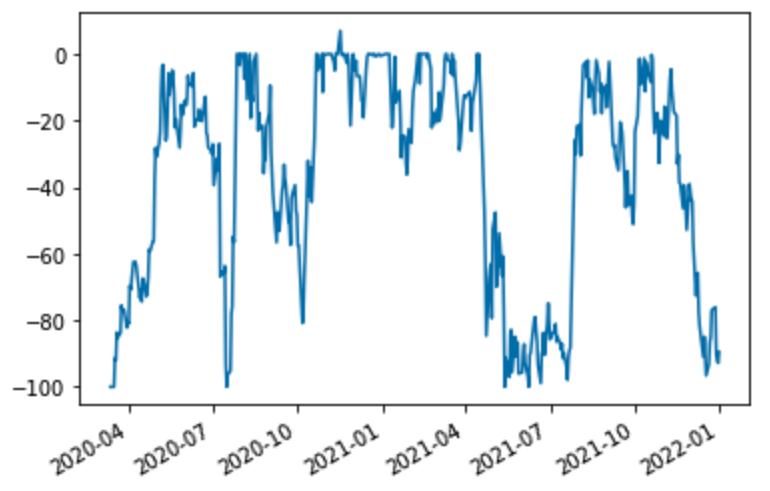
WR#
WR Indicator.
Williams %R indicator is a momentum indicator of values between 0 and negative 100. Readings closer to -100 are considered oversold, those closer to 0 and considered overbought.
Python:
wr = tech_ind.wr(
    high = future.history(field="HighPrice"),
    low = future.history(field="LowPrice"),
    close = future.history(field="LastPrice"),
    window = 50,
    ewma = False
)

wr.plot()
Output: