Visual Studio Code#
Visual Studio Code, is an integrated development environment, or IDE.
JupyterLab provides useful building blocks for intuitive, interactive programming, while VS Code is code-focused and able to work on larger, more complex software utilising one or many Python files.
You cannot currently run interactive widgets within the Jupyter extension of VS Code. This includes widgets such as tree plot, interactive strategy widget, and interactive optimiser. These widgets can instead be used within the JupyterLab.
VS Code is a more complex research environment, best suited to advanced programmers. Instead of operating exclusively within a notebook format, it allows you to create, edit, and run any type of file.
Note: the use of VS Code and JupyterLab doesn’t have to be exclusive. Users can interact between them, reserving specific tasks for specific environments.
Tip: although Jupyter notebooks can be used within VS Code, with a pre-installed Jupyter extension, it is recommended that you use JupyterLab if you are only using notebooks.
Working with the SigTech codebase#
VS Code allows you to do the following:
Easily access the SigTech codebase
Study the structure and specifics of the framework
Determine the function of each constructor argument
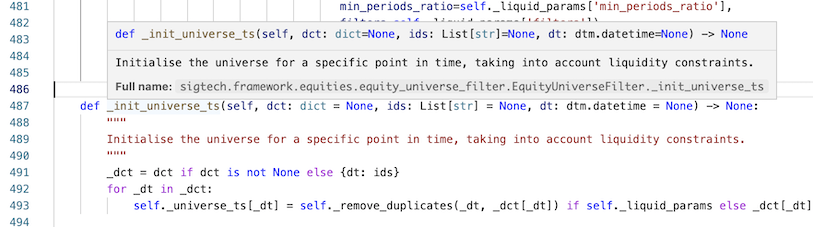
Features such as the go-to definition allow for the quick and easy navigation of source code. Search for a particular function, class, or method within the SigTech codebase and then follow the available links to explore its inheritance.
Drilling down reveals the docstrings and any planned updates to the code. This same functionality can be applied to Python libraries.
The environment goes further, facilitating the extension and customisation of SigTech functionality with the construction of multi-file Python modules.
You can build your own classes on top of existing code and use them across multiple notebooks.
Workspaces#
VS Code differentiates itself outside of the notebook, allowing for better organisation of files and folders within the workspace.
Whereas JupyterLab restricts the file browser to display only files and folders in a particular workspace, VS Code allows you to see all of the files and folders across all workspaces.
Layout#
Activity bar#
The activity bar allows you to toggle between views.
The icons display the following views:
Application menu: contains a set of menus offering a broad range of functionality.
Explorer: navigate your code or the SigTech framework, select files, and discern structure.
Search: search the entire codebase for a file, class, or code snippet to determine its purpose within the context of the broader framework.
Source Control: track local changes and identify differences with the code stored in git.
Run & Debug: run and debug your code.
Extensions: download and manage third party extensions to enhance the functionality of VS Code.
Testing: when a Python file is open the Testing icon is displayed. Configure, create, discover, debug, and run tests on your code.
To change settings and themes, click the Manage icon.
Side bar#
The side bar generates the views represented by the icons in the activity bar.
Status bar#

The status bar is located at the bottom of the VS Code Research Environment. It displays information and actions relating to your workspace:
Programming language
Current line number
Errors and warnings
Basic debugging#
Debugging a Jupyter notebook#
To debug Jupyter notebooks, through the Jupyter extension inside VS Code, do the following:
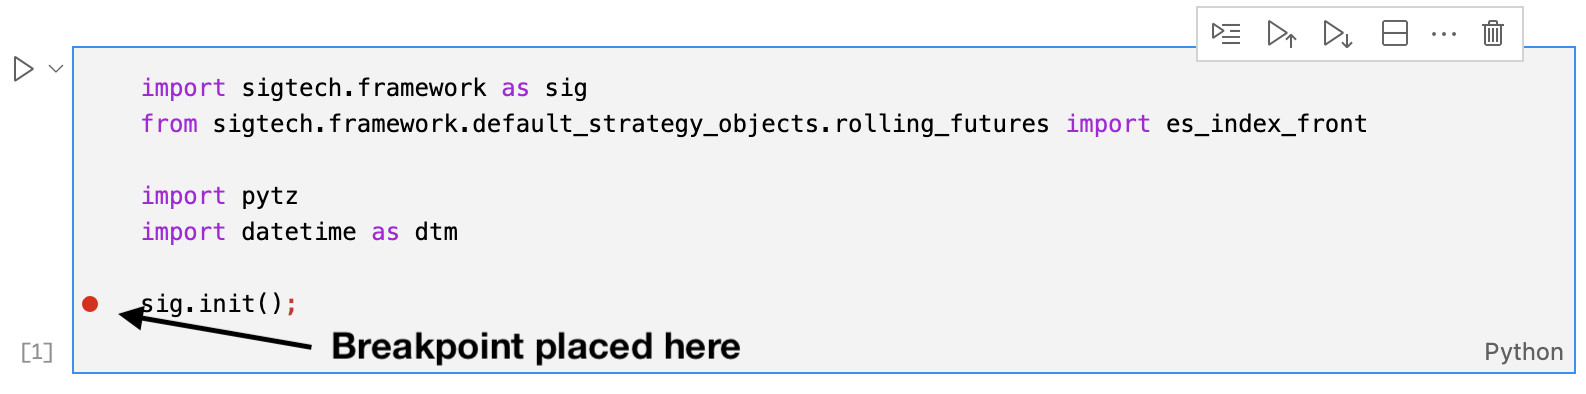
Place a breakpoint in one of the code cells of the notebook.
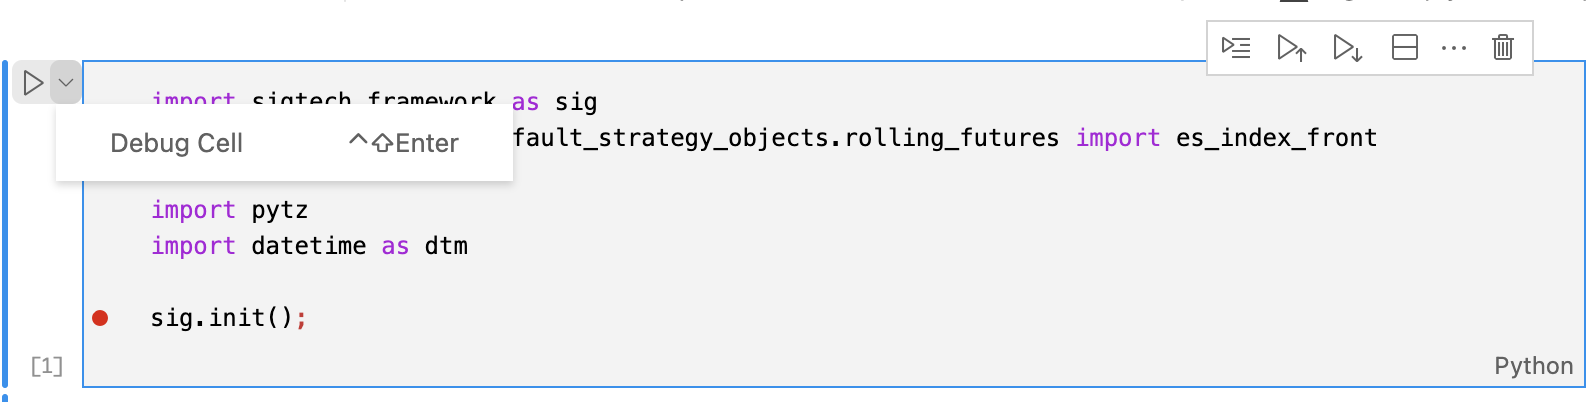
2. Click the Run Cell drop down menu > Debug Cell.
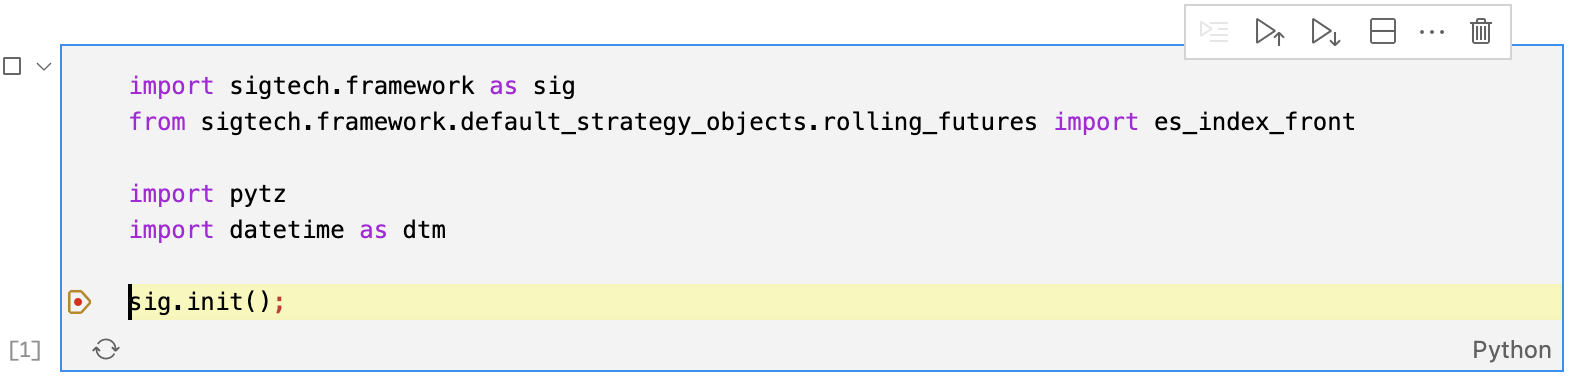
3. Once run, the debugger will stop at the breakpoint, showing the environment at that point in time.
Debugging a .py file#
To debug .py files inside VS Code, do the following:
Place a breakpoint inside the .py file.
In top-right of the screen, click Debug Python File in Terminal.
The debugger stops at the breakpoint, showing the environment at that point in time.
General debugging approach#
Use the built-in debugger in VSCode to quickly check all the variables associated with the scope you are analysing, without the need to insert print() commands.
Use a Breakpoint to check your script on a specific point. You can place as many breakpoints as you want. But for the debugger to run, you need at least one point—the reason is that the debugger does not stop until it finds a breakpoint. When the debugger finds a breakpoint, it pauses, displaying a snapshot of the code at that moment.
On the left of the screen, a section is divided into four parts:
VARIABLES: the values of the local and global variables, as of the breakpoint.
WATCH: create a variable you want to monitor, that may not necessarily be part of the script. Example: to watch if a variable is equal to a number you expect. The variable <num> will return an integer, but in WATCH, you can set
num == expected_value, to turn it into a Boolean that returnsTruewhen num is behaving correctly.CALL STACK: an overview is displayed of what you will be returning if you call in a specific function. CALL STACK is useful when using the command bar.
BREAKPOINTS: toggle the breakpoints that you have placed in the code, without the need to delete them.
Step through the code#
VS Code has a built-in tool that allows you to step through the code.
Step over: move to the next line of code.
Step into: step into any method or function call that is present on the line you are analysing.
Step out: takes you to the last return statement, and takes you to the function it was called from.
Widgets#
You cannot run interactive widgets within VS Code. This includes:
Interactive strategy widget
Tree plots
Interactive optimizer
Timeline
If you require this functionality, please use JupyterLab.
Basic plot functionality will work within VS Code, and the portfolio table is still available.
Configuration#
User specific configurations, such as colour theme and settings, do not persist between sessions in VS Code–when the research environment is restarted, the configuration will revert back to the default state.
Keyboard shortcuts#
To access a range of keyboard shortcuts:
| Shortcut | Function | |
|---|---|---|
⇧⌘P | Generate the Command Palette to access the functionality of VS Code | |
⌘P | Navigate to any file or symbol | |
⌃Tab | Cycle through the last set of files opened | |
⇧⌘O | Navigate to a specific symbol in a file | |
⌃G | Navigate to a specific line in a file | |
? | Lists available commands |
A set of additional keyboard shortcuts:
Shortcut |
Function |
|---|---|
|
Search for a code snippet within a project |
|
Go to definition |
|
Go to line number |
|
Previous cursor location |
|
Next cursor location |